Move Fast. Implement Smart.
Cloobot automates requirement gathering, user story creation, and delivery planning — helping teams move from discovery to dev in record time.
Book a DemoThe Parts of Implementation Everyone Dreads - Automated.

Metadata-powered intelligence
Cloobot scans your org's setup to assess the current state, uncover inefficiencies, and recommend improvements, so you can reduce technical debt and build with confidence.

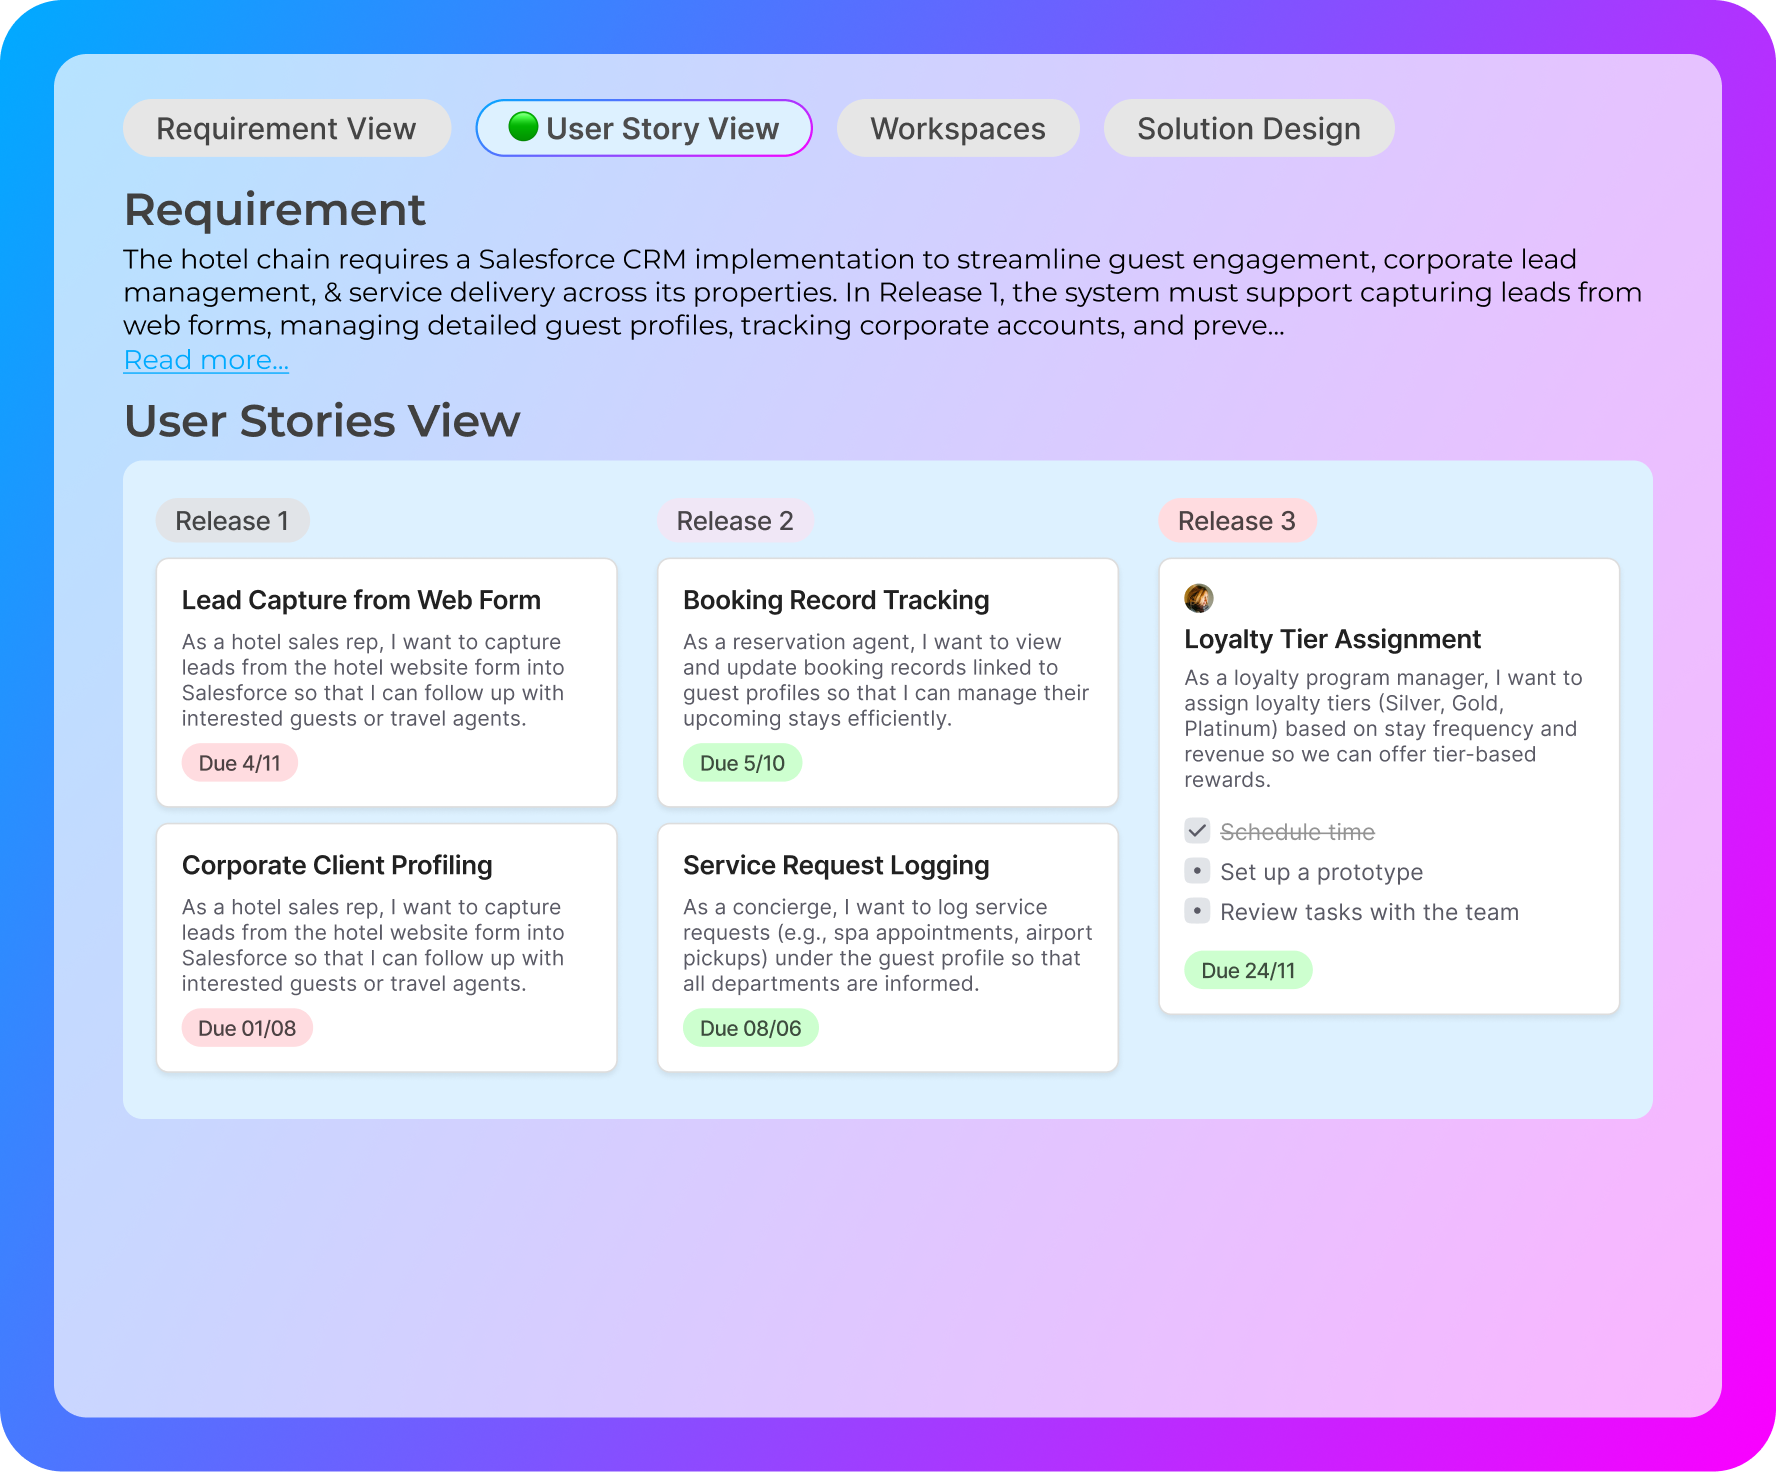
Context - Aware Documentation
Automatically generates & maintains requirements, user stories with acceptance criteria, & builds task breakdowns, versioned, context-aware, & always up to date as your project evolves.

Seamless integration
Effortlessly connects with your existing tools and workflows for a frictionless experience.
What Our Partners are Saying
"Partnering with Cloobot has fundamentally changed how we approach Salesforce delivery. What used to take weeks now happens in hours - without compromising quality."

"Cloobot significantly simplifies handling Salesforce requirements. It can transform BRD document into a comprehensive solution design, task-level design and perform gap analysis with 70-80% accuracy"

AI Agents, Real Delivery.
BA Agent
Captures business requirements with precision, turning conversations, notes, or inputs into complete, traceable specs including user stories and acceptance criteria. Never miss a detail, and reduce the discovery cycle by 50%.
Architect Agent
Analyzes org metadata, maps dependencies, and auto-generates scalable, implementation-ready designs. From task breakdowns to solution blueprints, the Architect Agent brings clarity before the first line of config.
Testing Agent
Auto-generates test scripts based on requirements and user stories, accelerating QA handoff and reducing bugs from day one. Ensure that what gets built matches what was asked.
Built for consulting firms and enterprise teams delivering on Salesforce and other complex systems.
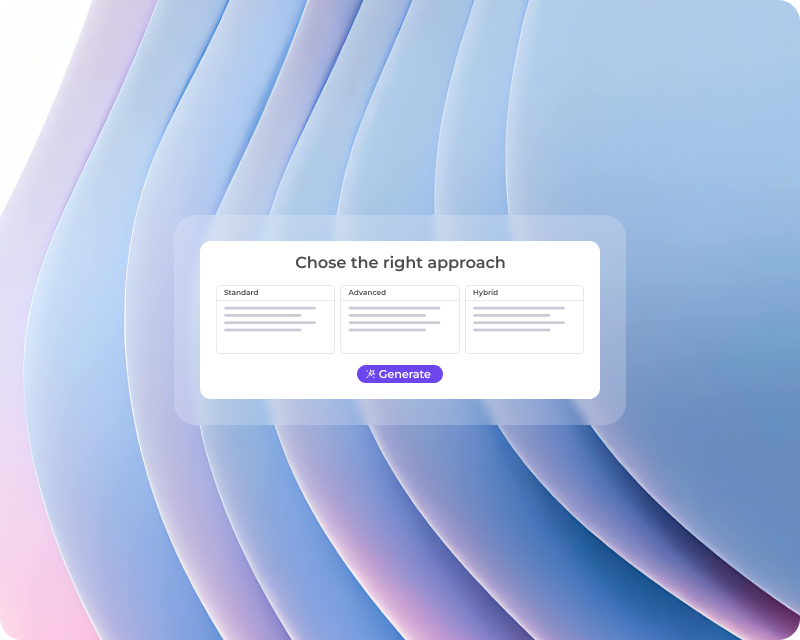
Understand the Ask. Nail the Requirements
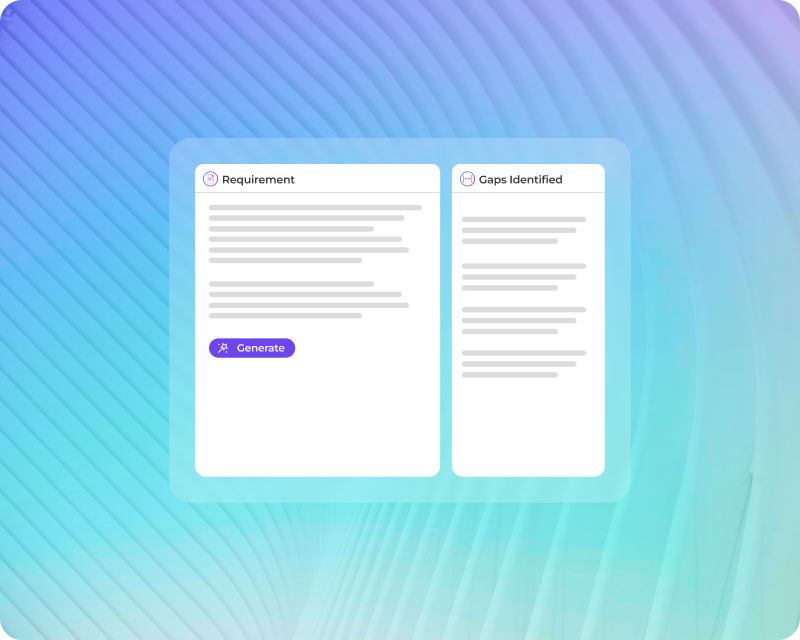
Cut the Busywork, Not Corners
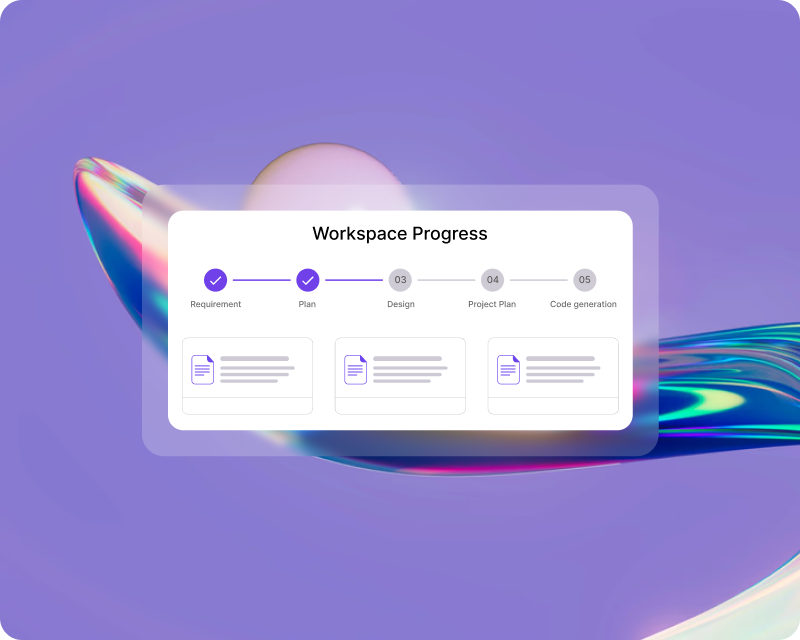
From Context to Clarity. Instantly